Our bad credit car finance specialists, who have a wealth of experience working with those with a poor credit history, in an IVA or have a CCJ crunched the numbers and looked at the number of people in each area with blots on their record, to find out which areas have racked up the most penalty points.
By examining how many drivers in each area have points on their licences, the data reveals clear national trends, regional differences, and some surprising insights into UK driving behaviour.
Key Findings from UK Driving Licence Penalty Point Data
The data relating to those with points on their licences has a lot to show us, with a few standout takeaways:
- In total, the UK’s drivers have racked up 10.6 million points between them.
- Of 41 million drivers in the UK, 2.7 million have at least one point on the licence (6.5%).
- The individual with the highest number of points on their licence is a 48-year-old man who has a whopping 66 points.
- There are currently three individuals aged 101 who have three points each on their driving licences.
- Men are twice as likely to break the law while driving compared to women! 8.64% of men with full driving licences have points on their licences, compared to just 4.16% of women, making men twice as likely to get points on their driving licences as women.
- The most common number of points to have on your driving licence is three, with 1,975,194 individuals currently holding this number of points on their licence.
Areas with the Most Points

The data shows a significant gender gap when it comes to driving offences:
-
8.64% of men with full driving licences have penalty points.
-
By comparison, only 4.16% of women have points on their licences.
-
This means men are more than twice as likely as women to receive penalty points while driving.
Areas with the Least Points

At the opposite end of the spectrum, several cities demonstrate significantly lower offence rates:
-
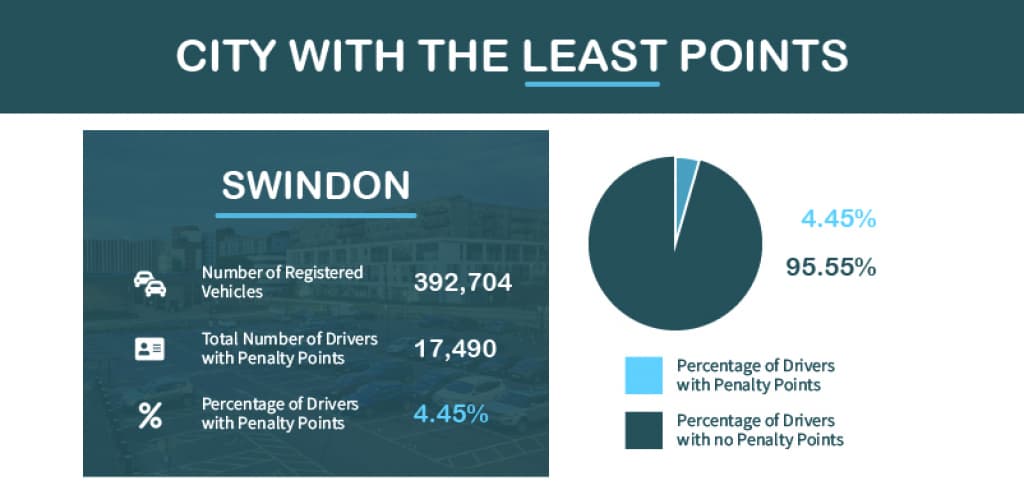
Swindon has the lowest percentage, with just 4.45% of drivers holding points.
-
Milton Keynes follows at 5.16%.
-
Canterbury also ranks among the lowest.

Methodology
How the Data Was Collected and Analysed
ChooseMyCar used official government data (table VEH0122), which provides figures on the number of registered vehicles in the UK by postcode, using the most recent data available.
The methodology involved:
-
Grouping postcodes into cities.
-
Identifying the number of drivers with penalty points in each area.
-
Calculating the percentage of drivers with points for each city.
-
Ranking cities based on these percentages to identify the highest and lowest offenders.
Frequently Asked Questions
What are driving licence penalty points?
Driving licence penalty points are added to a driver’s record when they commit a motoring offence, such as speeding or using a mobile phone while driving. These points remain on a licence for a set period and can affect insurance premiums and driving privileges.
How many penalty points do UK drivers have in total?
UK drivers collectively hold around 10.6 million penalty points, with approximately 2.7 million drivers having at least one point on their licence.
What is the most common number of points on a UK driving licence?
The most common number of penalty points is three, which is typically issued for minor offences such as low-level speeding.
Which UK city has the most drivers with penalty points?
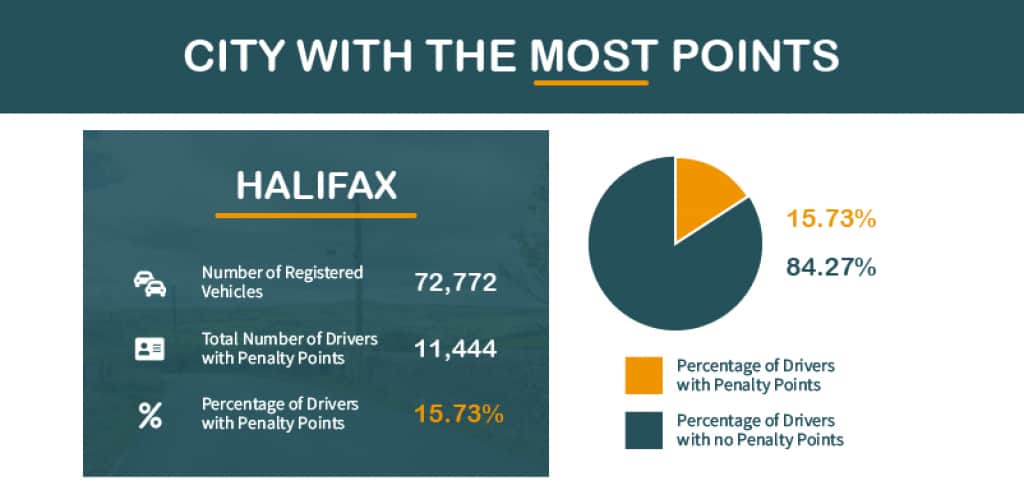
Based on the analysis, Halifax has the highest percentage of drivers with penalty points, with 15.73% of licence holders having points.
Make An Inquiry
Whether you want a compact car, SUV, or something eco-friendly, we've got it. Start your search now and find your perfect car!


